- Research Topics
- Department Optical and Rocket Soundings
- Department Radar Remote Sensing
- Department Modelling of Atmospheric Processes
- Working Group Satellite Data Analysis
- Cross-departmental Collaborations
- Projects
- Publications
Turbulence
The energy budget of the middle atmosphere, and especially the Mesopause region, is characterized by a complex interaction of a variety of fundamental physical and chemical processes, such as radiation, photochemistry and dynamic processes.
Gravity waves are excited in the troposphere by a variety of mechanisms (such as geography or convection) and then propagate upwards. Some of these waves grow unstable in the altitude range from 70-110 km where they break and their corresponding kinetic and potential energy is ultimately converted into heat.
The dynamic processes (summarized under the term "wave-mean flow interaction" (WMI)) drive the polar summer mesopause region about 80 K away from radiative equilibrium temperature and turbulent heating rates in the polar summer mesopause region are somewhere in the range of 10 K/day which is on the same order of magnitude as the direct solar radiation energy input. Despite this strong local heating by turbulence, the polar summer mesopause region is the coldest place in Earth's atmosphere with temperatures in the range of <130 K. This happens because the dissipating waves not only lead to a local heating effect but they also transfer their (pseudo)-momentum to the mean flow.
In the northern polar summer, this leads to an eastward acceleration of the mean flow resulting in turn in a meridional flow from the summer- to the winter pole. Mass continuity in turn requires the air masses to rise and expand (and cool adiabatically) over the summer pole and subside (and heat adiabatically) over the winter pole, thereby leading to the cold polar summer and warm polar winter mesopause.
While this qualitative picture appears to be largely understood and has indeed been tested by a variety of direct observations, there are many quantitative details that are still not properly characterized. Prominent examples are the global distribution of gravity wave sources as well as the details of the instability mechanisms which ultimately lead to the wave breakdown and its corresponding momentum and energy deposition in MLT. The latter process determines the overall thermal and dynamical structure of the MLT and hence is singularly decisive for the structure of the global circulation.

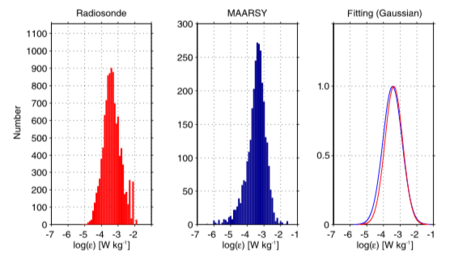
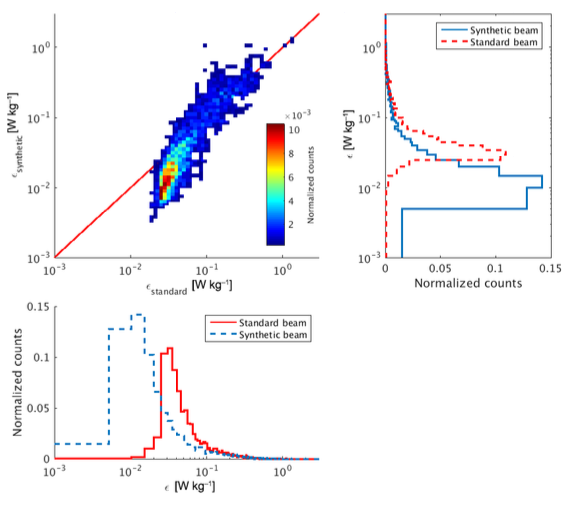
At the Radar Remote Sensing department atmospheric turbulence has been studied for many years using standard radar parameters, like reflectivity and spectral width, and more recently by characterizing the spatio-temporal features MLT dynamics. MAARSY spectral widths have been used to estimate turbulent kinetic energy dissipation rate (ε) in northern Norway at lower (Li et al., 2016) and MLT altitudes (Sommer and Chau, 2016). Figure 1 shows distributions of ε derived from radiosondes and from MAARSY in the upper troposphere and lower stratosphere, while Figure 2 shows values for polar mesosphere after and before correcting for beam broadening effects.

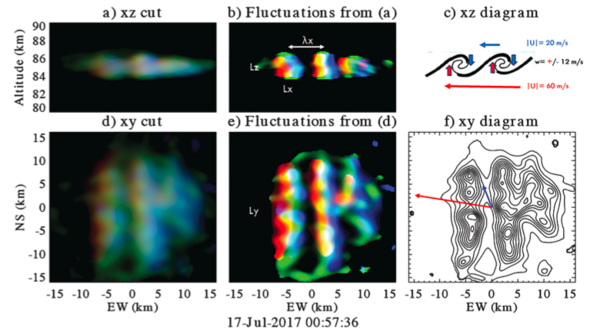
It is well-known that major sources of turbulence in the atmosphere are dynamic instabilities, like Kelvin Helmholtz Instabilities (KHI). Applying a newly developed radar imaging mode using MIMO (Multiple-Input Multiple-Output), Chau et al. [2020] has characterized a KHI event in the polar summer mesosphere in four dimensions. Figure 3 shows two dimensional cuts and a sketch of the KHI event that was characterized to present a Richardson number less than 0,25 (0.1-0.15) necessary for a KHI to occur, but also to occur in a flow with high Reynolds number and a Froude number close to 1, meaning that the flow was turbulent and weakly stratified. These parameters were obtained from a dimensional analysis using the measured spatial as well as velocity characteristics.

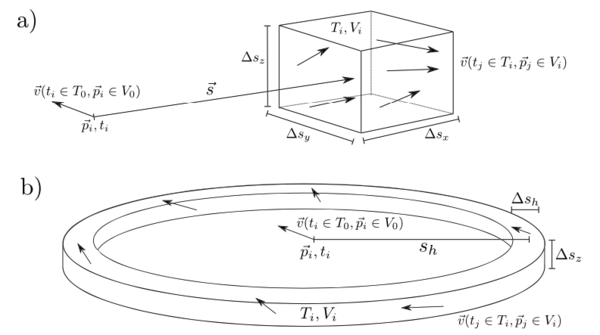
In the case of stratified turbulence, the horizontal scales are comparable to gravity wave scales, therefore they are not easy to separate from each other. Using the second-order statistics of measured line of sight velocities in multistatic specular meteor radar networks, Vierinen et al [2019] have presented a method to study MLT turbulence and waves. The method allows the 4D estimation of correlation, second-order structure and spectral functions of the 3D wind field. Figure 4 shows a schematic of how second-order statistics (lagged products) can be generated in spatial domain for a couple of options.

Publications
- Chau, J. L., Urco, J. M., Avsarkisov, V., Vierinen, J. P., Latteck, R., Hall, C. M., & Tsutsumi, M., Four dimensional quantification of Kelvin‐Helmholtz instabilities in the polar summer mesosphere using volumetric radar imaging, Geophysical Research Letters, 47. https://doi.org/10.1029/2019GL086081, 2020.
- Li, Q., M. Rapp, A. Schroen, A. Schneider, G. Stober, Derivation of turbulent energy dissipation rate with the Middle Atmosphere Alomar Radar System (MAARSY) and radiosondes at Andøya, Norway, Ann. Geophys., 34, 1209-1229, https://doi.org/10.5194/angeo-34-1209-2016, 2019.
- Sommer, S. and J. L. Chau, Patches of polar mesospheric summer echoes characterized from radar imaging observations with MAARSY, Ann. Geophys., 34, 1231-1241, doi:10.5194/angeo-34-1231-2016, 2016.
- Vierinen, J., J. L. Chau, H. Charuvil Asokan, J. Urco, M. Clahsen, V. Avsarkisov, R. Marino, and R. Volz, "Observing mesospheric turbulence with specular meteor radars: A novel method for estimating second order statistics of wind velocity", Earth and Space Sciences, 6, doi: 10.1029/2019EA000570, 2019.


