

Deriving gravity wave potential energy densities from RMR lidar measurements
Temperature fluctuations during a measurement
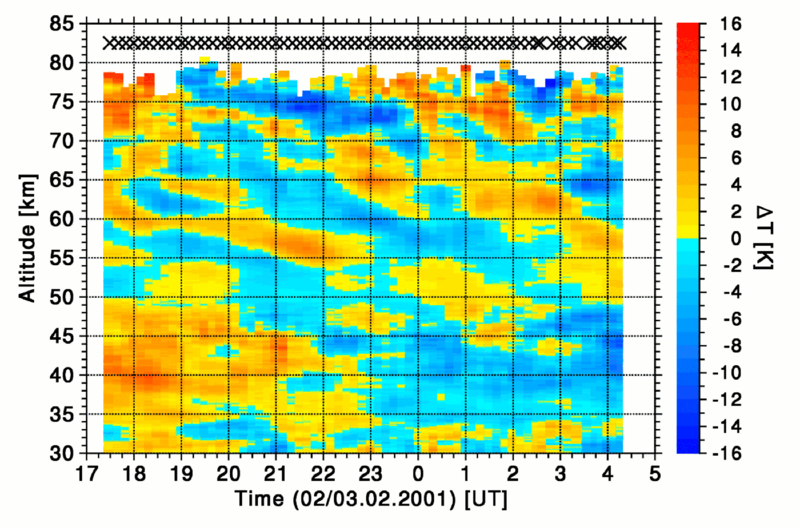
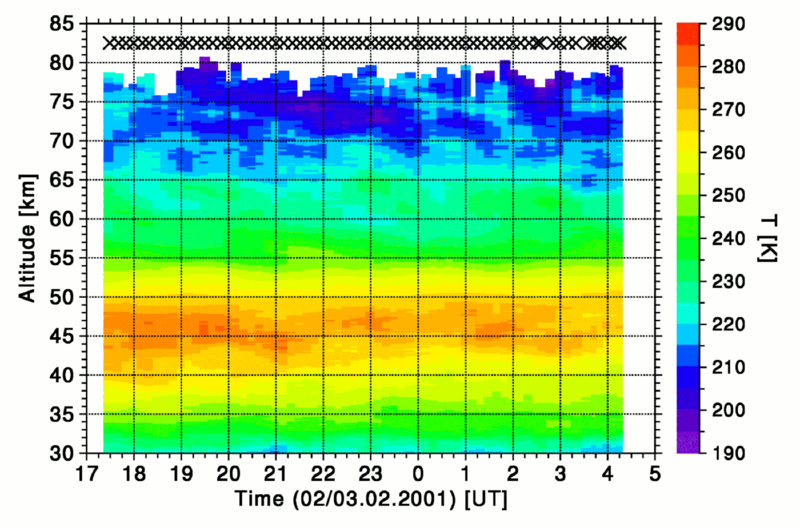
In the analysis of the seasonal variation of the temperature above ALOMAR, all raw data from one measurement were integrated before deriving the temperatures. This yields the mean temperature profile during a measurement. When analysing gravity waves, the focus are short-periodic temperature fluctuations with periods between a few minutes up to many hours.Therefore the raw data are integrated over one hour only and then the corresponding temperature profile is calculated. Then the integration period is shifted by 10 min. The results is the time-resolved change of the temperature structure during a measurement. An example for this is shown in Figure 1 for the RMR lidar measurement on 2/3 February 2001 17 UT–05 UT. The crosses in the upper part of the diagram mark the single profiles. Besides the general temperature structure with the temperature maximum of the stratopause at 47 km one can see the decrease of the temperature with height in the mesosphere. Additionally the figure shows that there are temperature fluctuations in the course of the night.To highlight these fluctuations that are caused by gravity waves, the night-mean temperature profile is calculated as the mean of the single profiles. This night-mean temperature profile is then subtracted from all single profiles. This gives the temperature fluctuations around the night-mean temperature which are plotted in Figure 2. Again the crosses in the upper part of the diagram mark the single profiles. Regions where the temperature is higher than the night-mean temperature are shown in yellow and red, temperatures below the night-mean are marked in blue. One can see downward phase propagation. This corresponds to upward propagating gravity waves. Additionally it is clear that we always observe a number of waves with different parameters above ALOMAR.
Gravity wave energy density
Since it is hard to identify and separate the single gravity waves, we estimated the strength of the gravity waves during a measurement by calculating the gravity wave potential energy density per mass Epot,M for each measurement as:
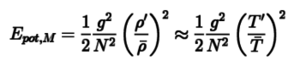
Here g is the gravitational acceleration, N is the Brunt-Väisälä frequency and ρ' and T' are the air density and temperature deviations from the night-mean, respectively. The mean air density and temperature during the measurement are marked by overbars. This gravity wave potential energy density per mass increases exponentially with height for an undamped wave to keep its energy constant despite of the decrease of the air density with height. The gravity wave potential energy density is then used to investigate the seasonal variations of the gravity wave energies in the temperature measurements of the RMR lidar.
Absolute temperatures
Temperature deviation