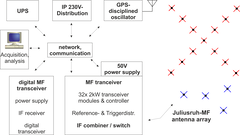
Between 1990 and 2003 a MF-radar was in operation in Juliusruh working with the FMCW (Frequency Modulated Continuous Waves) method at a frequency of 3.18 MHz. This radar has been replaced in spring 2003 by a new modular transmission and reception system with distributed power and a new so-called Mills-Cross-Antenna. Now the radar is working with a peak pulse power of 64 kW. Other technical parameters are collected in the table.
Technical Parameters
| Frequency | 3,18 MHz |
| Peak power | 64 kW |
| Pulse width | 27 µs |
| 3dB Beam width | 18° |
| Height resolution | 4 km |
| Sampling resolution | 1 km |
| Receiver channel | 6 digital |
| Pulse coding | none, 4 bit |
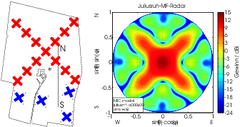
The Mills-cross-antenna used for transmission (red crosses) is presented in the enclosed figure together with the receiving antennas (blue crosses) on the area of the station Juliusruh. Due to the limited available area the Mills-Cross-Antenna with a total of 13 crossed half wave dipoles is smaller than those of the Saura-MF-radar. Each dipole antenna is connected with a separate transmission and reception unit. These antennas are weighted by 3 dB steps from the centre toward the outer antennas, thus reducing the side lops of the full antenna diagram. The resulting beam width of the antenna is 18°. The antenna beam can be inclined by well defined angles, thus permitting DBS- (Doppler Beam Swinging) measurements.

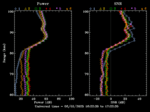
There are also interferometric observations possible as well as the use of different polarisations for the transmitted and received signals. The last possibility permits the estimation of electron densities for the height range between about 70 and 85 km from differential absorption and phase measurements. For an optimum continuation of the data series of mesospheric winds and tides started in 1990, the larger Mills-cross-antenna is only used for transmission while the five separate antennas are used for reception. From a cross correlation analysis of the signals received at the spatially separated antennas the mesospheric wind field is estimated (spaced antenna method, SA). Examples are presented in the enclosed figure.


